File:WL-0001-Fig2.jpg
Jump to navigation
Jump to search

Size of this preview: 589 × 599 pixels. Other resolution: 1,523 × 1,549 pixels.
Original file (1,523 × 1,549 pixels, file size: 188 KB, MIME type: image/jpeg)
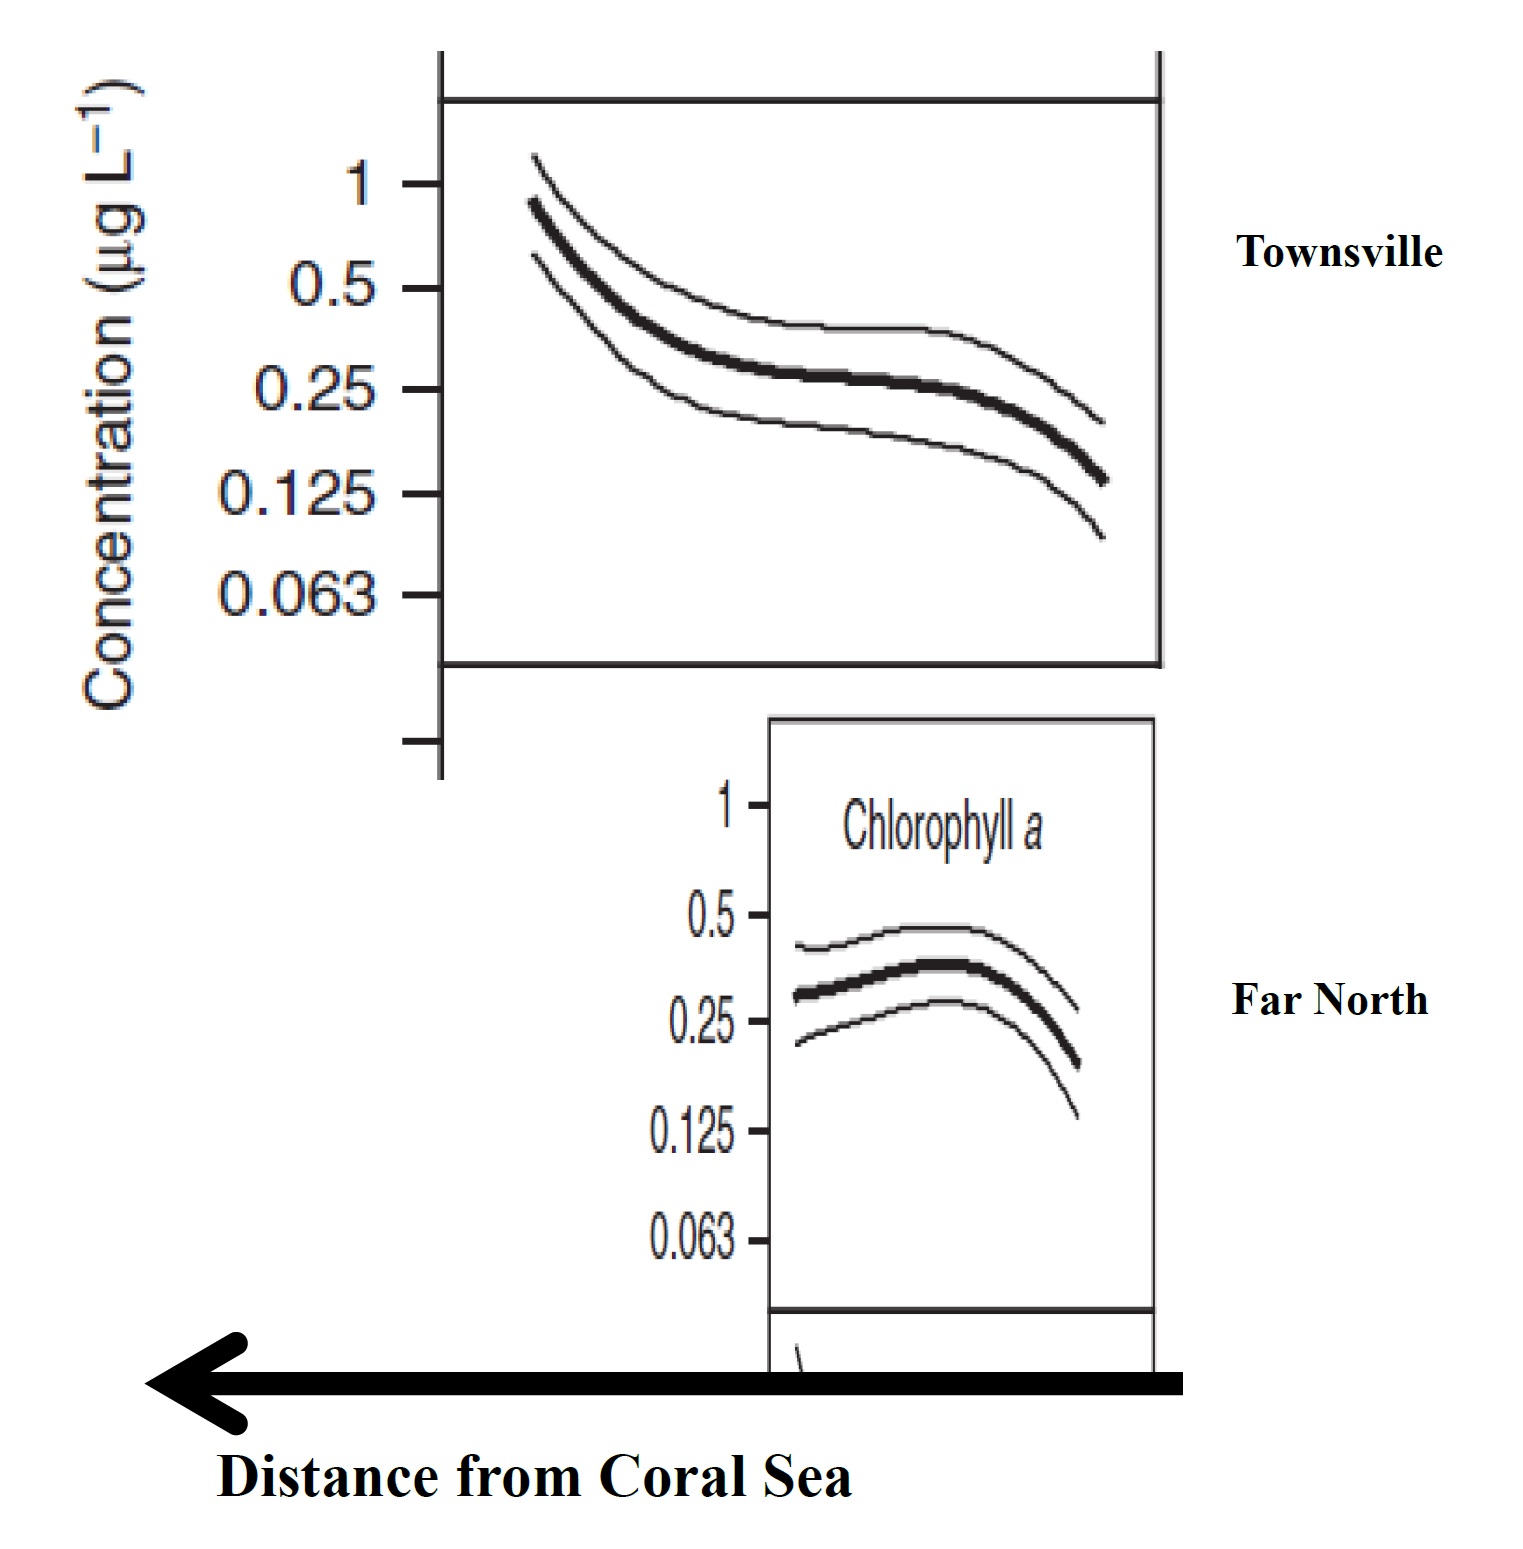
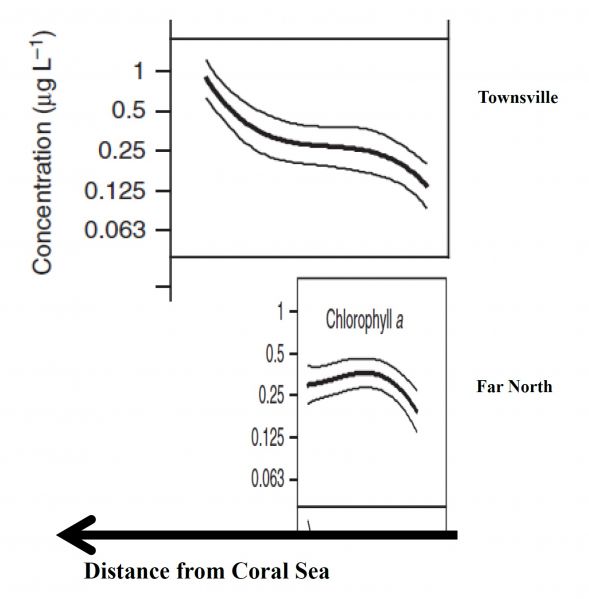
Figure 2: The far Northern data are scaled to take account that the Far Northern region is much wider than the Townsville region (From Brodie et al., 2007). The graphs are aligned to match the positions of the boundary with the Coral Sea. It is notable that the Chl a concentrations are very similar in the north and Townsville regions (0.4 mg/l) for similar distances from the Coral Sea.
File history
Click on a date/time to view the file as it appeared at that time.
| Date/Time | Thumbnail | Dimensions | User | Comment | |
|---|---|---|---|---|---|
| current | 05:52, 2 July 2022 | | 1,523 × 1,549 (188 KB) | Fpa1981 (talk | contribs) |
You cannot overwrite this file.
File usage
The following 2 pages use this file: