Doi.org/10.1071/MF06236
Target Article
Brodie, J., De’ath. G., Devlin M., Furnas, M., Wright, M., (2007) Spatial and temporal patterns of near-surface chlorophyll a in the Great Barrier Reef lagoon, Marine and Freshwater Research, 58: 342-353 Available at: http://dx.doi.org/10.1071/MF06236 DOI: 10.1071/MF06236
Significant Claim
Nutrient pollution from agricultural runoff has caused plagues of coral-eating Crown of Thorns Starfish (COTS), which are destroying the reef.
Fabricius et al. (2010)[1] used laboratory experiments to demonstrate that higher Chlorophyll A (Chl A) concentrations (due to phytoplankton) increase the survival rate of Crown of Thorns Starfish (COTS) larvae. Citing the work of Brodie et al. (2007)[2], who claim that Chl A concentrations are twice as high in the central region of the Great Barrier Reef GBR, which receives more agricultural runoff than in other regions, they propose that the higher Chl A concentrations in the central GBR trigger COTS outbreaks and thereby in due course reduce the coral cover. This is a central theme of the recent GBR Consensus Statement (Brodie et al., 2013[3]), which outlines the main arguments for how agricultural practices are damaging the reef. This hypothesis rests crucially upon the observation that Chl A concentrations are higher in the central GBR region than in the relatively pristine northern region. This observation, which is the work of Brodie et al. (2007)[2], will be the main subject of scrutiny in this letter.
Possible caveats with this article

The hypothesis that COTS are destroying the GBR has been in and out of favour since the first COTS plagues were identified in the 1960’s in the pioneering days of marine biology on the GBR. From the start, it was claimed that these plagues were not natural, though the basis for this assumption was unclear. At first it was suggested that the COTS outbreaks were caused by overfishing of Triton shells, which are a known predator of adult COTS (Pearson and Endean, 1969[4]). A major outbreak of COTS in the early 1980’s, and the associated media attention, precipitated the AIMS long-term monitoring program, which documents the percentage of coral cover of over 214 Reefs.
Other work has disputed the hypothesis that COTS outbreaks are anthropogenically caused. By searching for COTS skeletal remains in sediment cores taken from reefs, Walbran et al. (1989)[5] have shown that COTS outbreaks have occurred continuously during the last few thousand years and that there is no evidence that they are more widespread today. There was some critical commentary about this work (e.g. Fabricius and Fabricius, 1992[6]), which was largely addressed by Henderson & Walbran (1992)[7], but curiously the original work by Henderson and Walbran (1992)[7] seems to have been almost forgotten and is very poorly taken into account, despite its great significance.
In the scientific literature, linking COTS outbreaks to nutrient pollution has occurred throughout the last decade. As it is certain that higher nutrient loads originate coming from river plumes, these indeed have the potential to cause enhanced phytoplankton (Chl A) concentrations, which in turn could influence COTS larval survival. However, the supposed duplicating of Chl A concentrations due to agricultural nutrient enrichment in the central GBR (Brodie et al., 2007[2]) is problematical for two reasons:

- First, the GBR waters are estimated to rapidly flushed to the Coral Sea (around 1 month e.g. Choukroun et al., 2010[8]; Wang et al., 2007[9]). So, assuming this flushing time is relatively short, we can then expect the same volume of water that is discharged by rivers in an entire year is flushed to the Coral Sea in less than a day. Consequently, the volume of water discharged by the rivers in a day would little exceed a day to be flushed into the Coral Sea. Simple mass balance calculations indicate that this rapid flushing must reduce system-wide long-term nutrient enhancement to very low levels.
- Second, the river discharge is only a very small component of the nutrient cycle in the GBR. For example, the recycling of Nitrogeand Phosphorus through the seabed is over 100 times the rate of delivery from rivers (Furnas et al., 1995[10]).
It is therefore difficult to accept the proposition that the doubling in phytoplankton concentrations could solely be a result from a minor increment in nutrient input from rivers into this well-flushed system.
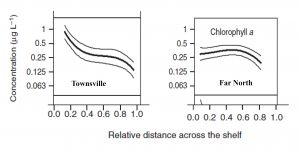
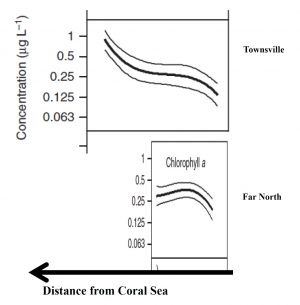
One possible explanation to this paradox is that the assertion that the Chl A concentrations in the central GBR are double those of the other regions may be wrong, or is misrepresenting the fundamental differences that may exist between the various regions. Determining an average Chl A concentration for a region is not a trivial task, because it can depend on the proximity of the sampling sites to the open sea. Due to rapid flushing, sites close to the Coral Sea will have low Chl A concentration. The shelf width thus becomes a primary factor controlling Chl A concentration due to the less efficient flushing of wider shelves. The northern GBR is very narrow, at ca. 20 km at one of the transects used by Brodie et al. (2007)[2], in contrast to the central region which is ca. 100 km wide. It is notable that the central GBR displays a strong Chl A concentration gradient across the shelf, which is likely to be the result of the longer flushing times of the inner-shelf waters compared with the very short flushing times of the offshore water. The northern GBR shows no cross-shelf concentration gradient, possibly because the entire shelf is rapidly flushed, along with the lagoon. A simple average of the concentrations for the two regions that does not take account of the shelf-width difference, such as that apparently done by Brodie et al. (Figure 11) is fraught with danger (Figure 2) and further may prove to be not correct.
Another obvious difference between the northern and central regions of the GBR is the sampling of large sheltered muddy embayments along the coast of the central region, but not in the Northern Region. These embayments are likely to contain higher Chl A concentrations because of the natural cycling of nutrients across the sediment/water interface. These muddy embayments were sampled by Brodie et al (2007)[2] in Cleveland Bay and Trinity Bay in the central region, whereas the only large muddy embayment in the northern region (Princess Charlotte Bay) was not sampled.
The reader may assume that such problems would have been taken into account in the sampling design and subsequent data analysis, but such optimism may be misplaced. There appears to have been no analysis of the data that related the distance of the Coral Sea to Chl A concentration. It would also be interesting to explore the influence of the sites located in the muddy inner-shelf embayments, which are well-represented in the central region, but entirely absent from the northern region dataset. Given the importance of this dataset, there is ample justification for reanalysis.
Conclusion
This is a very important data set which is being used to make public policy decisions. There is a prime facie case that the analysis and data have relevant issues and therefore there is a need to undertake careful reanalysis and to take supplementary measurements. The question is will this ever happen?
References
- ↑ * [1] Fabricius, K.E., Okaji, K., De’ath, G., (2010) Three lines of evidence to link outbreaks of the crown-of-thorns seastar Acanthaster planci to the release of larval food limitation, Coral Reefs, 29:593–605, doi: 10.1007/s00338-010-0628-z
- ↑ 2.0 2.1 2.2 2.3 2.4 2.5 2.6 * [2] Brodie, J., De’ath, G., Devlin, M., Furnas, M., Wright, M., (2007) Spatial and temporal patterns of near-surface chlorophyll a in the Great Barrier Reef lagoon, Australian Journal of Marine and Freshwater Research, 58:342–353, doi:10.1071/MF06236
- ↑ * [3] Brodie, J. et al., (2013) Scientific Consensus Statement - Land use impacts on Great Barrier Reef water quality and ecosystem condition, available at: https://www.reefplan.qld.gov.au/about/scientific-consensus-statement.aspx
- ↑ * Pearson, R.G., and Endean, R., (1969) ‘A preliminary study of the coral predator Acanthaster planci (L.) (Asteroidea) on the Great Barrier Reef’, Queensland Fisheries Branch, Fisheries Notes, 3:27-55
- ↑ * [4] Walbran, P.W., Henderson, R.A., Jull, A.J.T., Head, J.M., (1989) Evidence from sediments of long-term Acanthaster planci predation on corals of the Great Barrier Reef, Science, 245:847-850, doi:10.1126/science.245.4920.847
- ↑ * [5] Fabricius, K.E., Fabricius, F.H., (1992) Re-assessment of ossicle frequency patterns in sediment cores: rate of sedimentation related to Acanthaster planci, Coral Reefs, 11:109–114, doi:10.1007/BF00357431
- ↑ 7.0 7.1 * [6] Henderson, R.A., and Walbran P.D., (1992) Interpretation of the fossil record of Acanthaster planci from the Great Barrier Reef: a reply to criticism, Coral Reefs, 11:95-101, doi: 10.1007/BF00357429
- ↑ * [7] Choukroun, S., Ridd, P.V., Brinkman, R., and McKinna, L., (2010) On the surface circulation in the western Coral Sea and residence times in the Great Barrier Reef, J. Geophys. Res., 115:C06013, doi:10.1029/2009JC005761
- ↑ * [8] Wang, Y., Ridd, P.V., Heron, M.L., Stieglitz, T.C., Orpin, A.R., (2007) Flushing time of solutes and pollutants in the central Great Barrier Reef lagoon, Australia, Marine and Freshwater Research, 58:778-791, doi:10.1071/mf06148
- ↑ * [9] Furnas, M., Mitchell, A.W., Skuza, M., (1995) Nitrogen and Phosphorus budgets for the Central Great Barrier Reef Shelf, In: A Report to the Great Barrier Reef Marine Park Authority, Research Publication No. 36, url: https://hdl.handle.net/11017/240
Comments
In WL-Letters you have the freedom to respond to any caveat that may be inaccurate.
-- Andutta (talk) 18:13, 6 July 2022 (UTC)